
In this Seaborn tutorial, you will learn how to add a Seaborn legend to plots. You can add a legend to plots with the help of the built-in function plt.legend().
# import required modules
import seaborn as sns
import matplotlib.pyplot as plt
# load the dataset
var = sns.load_dataset('iris')
# create a scatter plot using seaborn
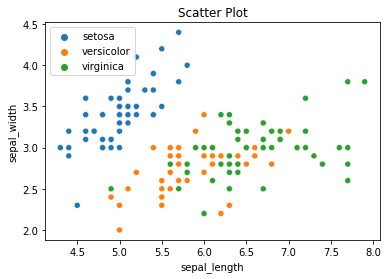
sns.scatterplot(x = 'sepal_length', y = 'sepal_width', data = var, hue = 'species')
# set the title of the plot
plt.title('Scatter Plot')
# set the legend
plt.legend(loc = 'upper left')
# save the plot
plt.savefig('scatterplot_legend.png')
# show the plot
plt.show()Output:
Free resources to learn advanced skills: AiHints and CodeAllow