
In this Seaborn tutorial, you will learn how to plot a Seaborn distplot in Python. Seaborn provides a built-in function sns.distplot() for this task.
# import required modules
import seaborn as sns
import matplotlib.pyplot as plt
# load the dataset
var = sns.load_dataset('tips')
# create a dist plot using seaborn
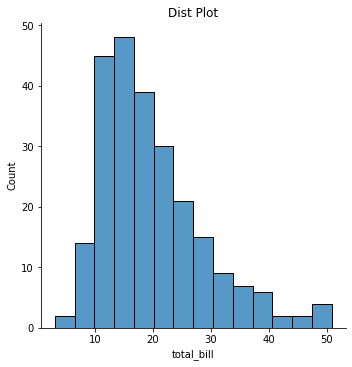
sns.displot(var['total_bill'])
# set the title of the plot
plt.title('Dist Plot')
# save the plot
plt.savefig('distplot.png')
# show the plot
plt.show()Output:
Free resources to learn advanced skills: AiHints and CodeAllow